
Thirty percent of the S&P 500 will report third quarter earnings this week. Based on earnings already in and analyst expectations, earnings are expected to grow 32.7% compared to last year as corporations continue to bounce back from a COVID-led earnings decline.
Key Points for the Week
- Earnings season is off to a strong start, and 30% of companies in the S&P 500 report this week. Earnings are expected to grow 32.7% and will likely grow more as companies usually beat expectations.
- U.S. industrial production slid 1.3% last month as the shortage of semiconductors pushed auto production down 7.2%.
- Chinese GDP increased only 4.9%. Energy shortages in China forced production halts that limited economic growth.
The most significant challenge for markets and the economy remains the supply shortages that are pressuring prices higher. U.S. industrial production shrank 1.3%. As Figure 1 shows, the monthly decline was larger than any seen from 2017 to 2019. Auto manufacturing dropped 7.2% last month, largely due to a shortage of semiconductor chips and other supply difficulties.
Energy shortages in China have contributed to a slower global recovery. Limited blackouts have curtailed production. Chinese industrial production grew only 3.1% during the last 12 months, a 2.2% decline from last month’s report. China’s economy continues to grow rapidly compared to the U.S., but its growth trend hasn’t been as strong post-COVID.
On balance, investors decided the news was good enough for equity markets to rise sharply. The S&P 500 jumped 1.7% and reached a new all-time high. The global MSCI ACWI added 1.3%. The Bloomberg U.S. Aggregate Bond Index gave back 0.4% as concerns about increased inflation remain a risk for bond investors. The aforementioned third quarter earnings reports and third quarter U.S. gross domestic product headline economic data released this week.
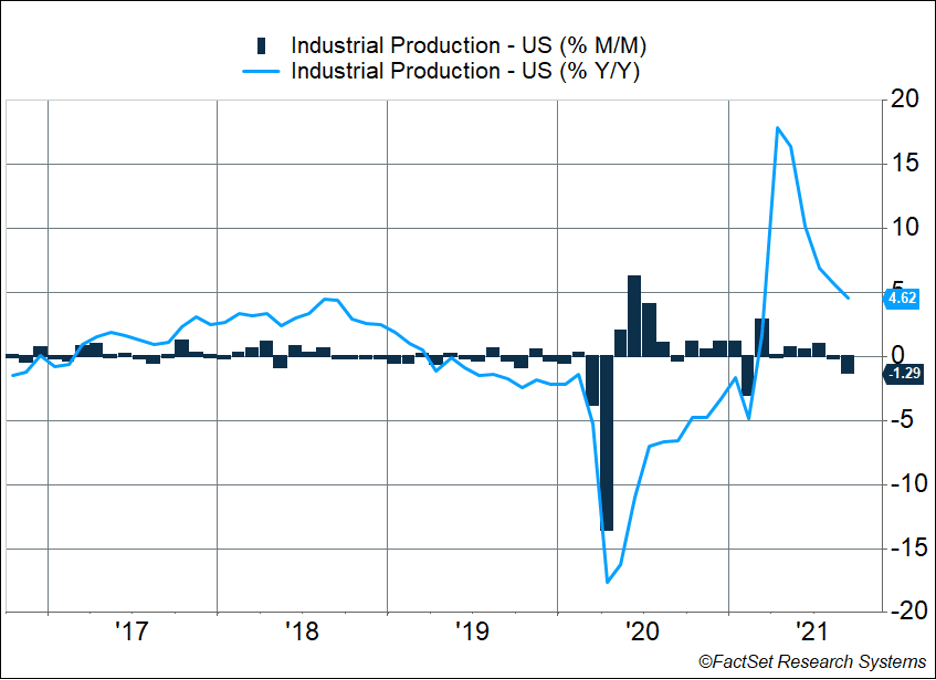
Figure 1
Earnings Season
Once again, earnings season is off to a hot start. More S&P 500 companies than normal are beating estimates, and by wide margins.
Overall, of the companies reporting, 84% have beaten estimates versus the long-term average of 76%, and the average earnings beat is 13.4% above estimates compared to an average of 8.4%. Earnings strength is broad-based across several sectors, led by information technology, health care, financials, and communication services.
We are still in the early stages of earnings season with only 23% of companies reporting so far, But this week should be interesting with another 164, or 30% of companies in the S&P 500, reporting.
The growth in earnings has helped push equity markets even higher, causing the S&P 500 index to surpass its previous record high. Market jumps without increased earnings can push valuations up. Valuations have moderated in recent quarters as earnings have risen faster than the market. Even with the earnings gains, valuations remain higher than normal. The forward 12-month price-to-earnings ratio for the S&P 500 is 21, which is higher than the five-year average of 18.3 and the 10-year average of 16.4.
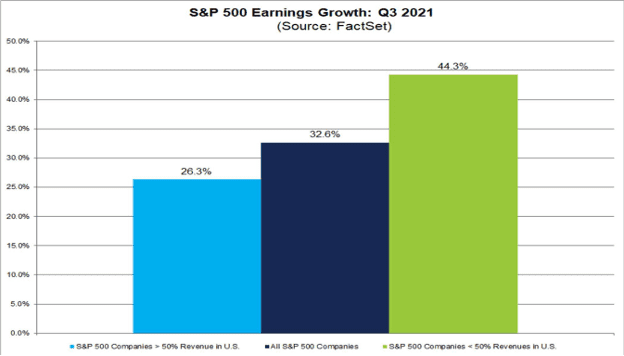
Also interesting is comparing companies in the S&P 500 that generate most of their revenue overseas with those that generate the majority in the United States. Given the disparity in economic recoveries, one might think that companies with more revenue coming from the U.S. would be doing better, but that’s not the case. The third-quarter earnings growth rate is 44.3% for companies that generate more than 50% of their revenue outside the U.S. and 26.3% for domestic-focused companies.
We will be monitoring earnings releases over the next few weeks. Some of the largest tech companies will report next. While the information technology sector has performed well, there have been some notable misses in the sector. Future quarters will also begin to face tougher comparisons, and the outlook, as well as the numbers, are likely to make the next few weeks extra interesting.
–
This newsletter was written and produced by CWM, LLC. Content in this material is for general information only and not intended to provide specific advice or recommendations for any individual. All performance referenced is historical and is no guarantee of future results. All indices are unmanaged and may not be invested into directly. The views stated in this letter are not necessarily the opinion of any other named entity and should not be construed directly or indirectly as an offer to buy or sell any securities mentioned herein. Due to volatility within the markets mentioned, opinions are subject to change without notice. Information is based on sources believed to be reliable; however, their accuracy or completeness cannot be guaranteed. Past performance does not guarantee future results.
S&P 500 INDEX
The Standard & Poor’s 500 Index is a capitalization-weighted index of 500 stocks designed to measure performance of the broad domestic economy through changes in the aggregate market value of 500 stocks representing all major industries.
MSCI ACWI INDEX
The MSCI ACWI captures large- and mid-cap representation across 23 developed markets (DM) and 23 emerging markets (EM) countries*. With 2,480 constituents, the index covers approximately 85% of the global investable equity opportunity set.
Bloomberg U.S. Aggregate Bond Index
The Bloomberg U.S. Aggregate Bond Index is an index of the U.S. investment-grade fixed-rate bond market, including both government and corporate bonds.
https://www.federalreserve.gov/releases/g17/current/default.htm
Compliance Case # 00838641
