
Last Friday, yet another strong payroll report was released with the headlines stating payrolls grew 263,000 in September and the unemployment rate fell to 3.5%.
The first three charts below illustrate the strength and resiliency of the labor market this year. The last two are forward-looking indicators that bode well for continued employment gains.
-
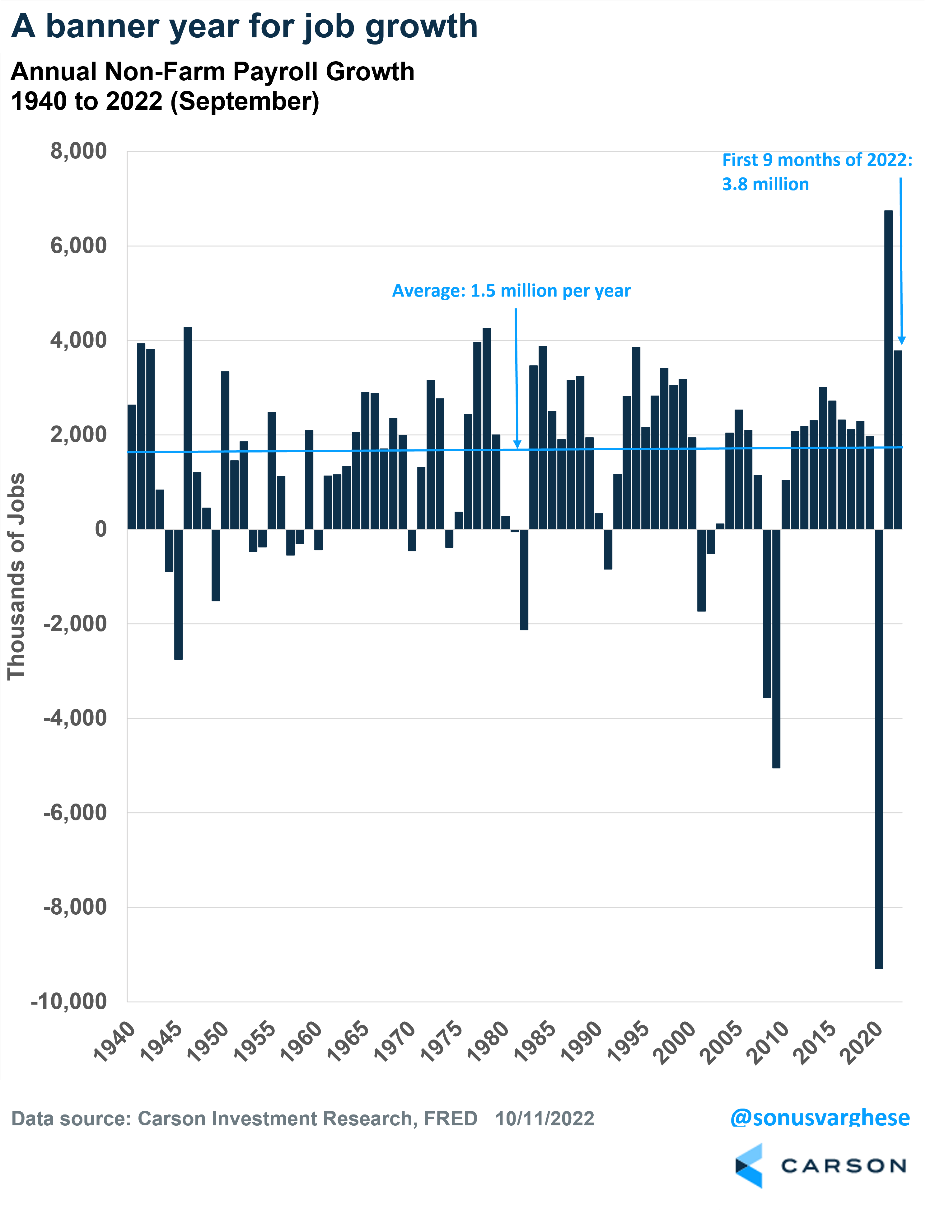
3.8 million jobs created in 2022 (so far)
Payroll growth has certainly slowed over the last few months, from 537,000 in July to 315,000 in August and then 263,000 in September. But make no mistake: These are robust numbers, and the big picture is that 3.8 million jobs were created over the first nine months of 2022.
Even if the economy created zero jobs over the next year, 2022 would be the 9th best year for job creation since 1940. And if the next three months saw another 500,000 jobs created, 2022 would end up as the 2nd best year behind 2021 (which was boosted by the COVID recovery).
-
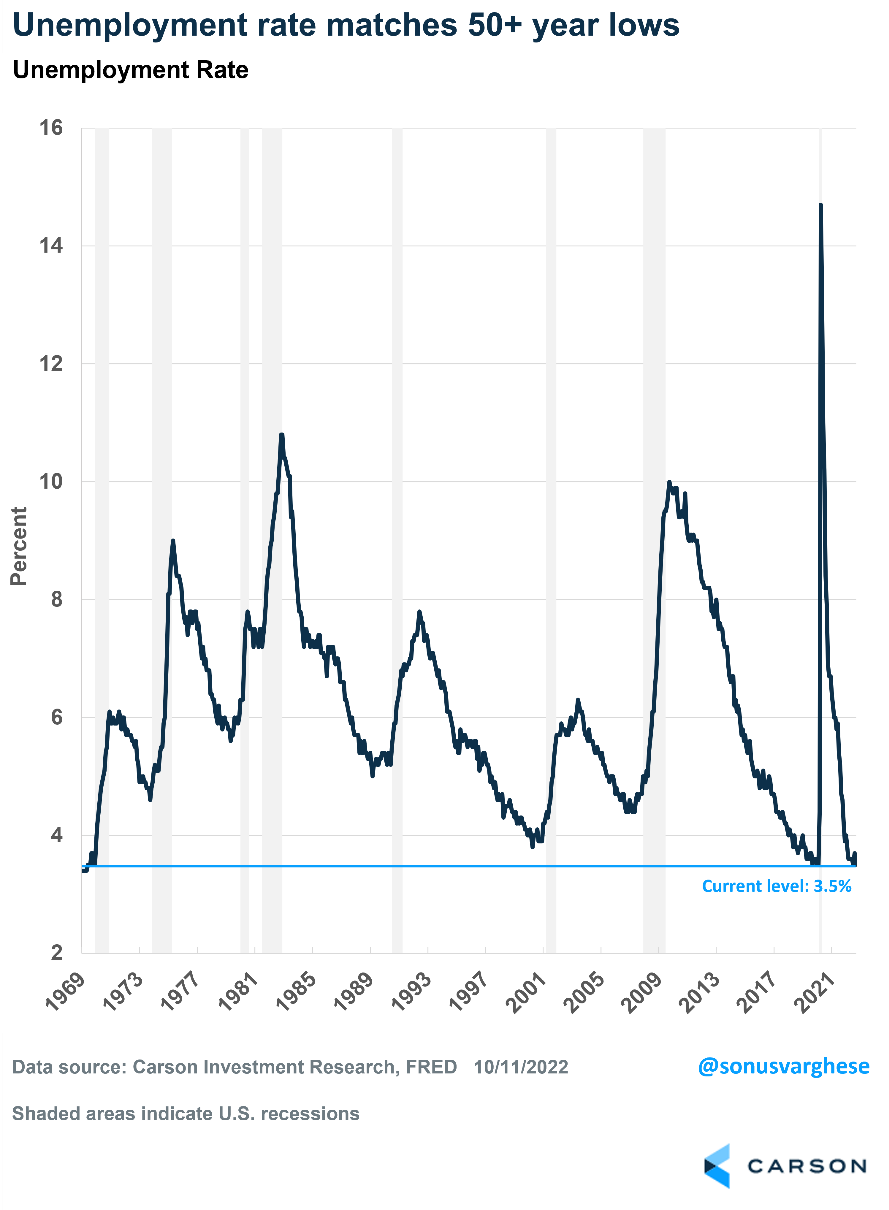
Unemployment rate falls to pre-crisis low (also the lowest since 1969)
Unemployment fell from 3.7% to 3.5% in September, going in the opposite direction of what Federal Reserve officials expect amid their interest rate hikes. The 3.5% rate matches the lowest it reached during the last expansion and is the lowest since 1969.
-
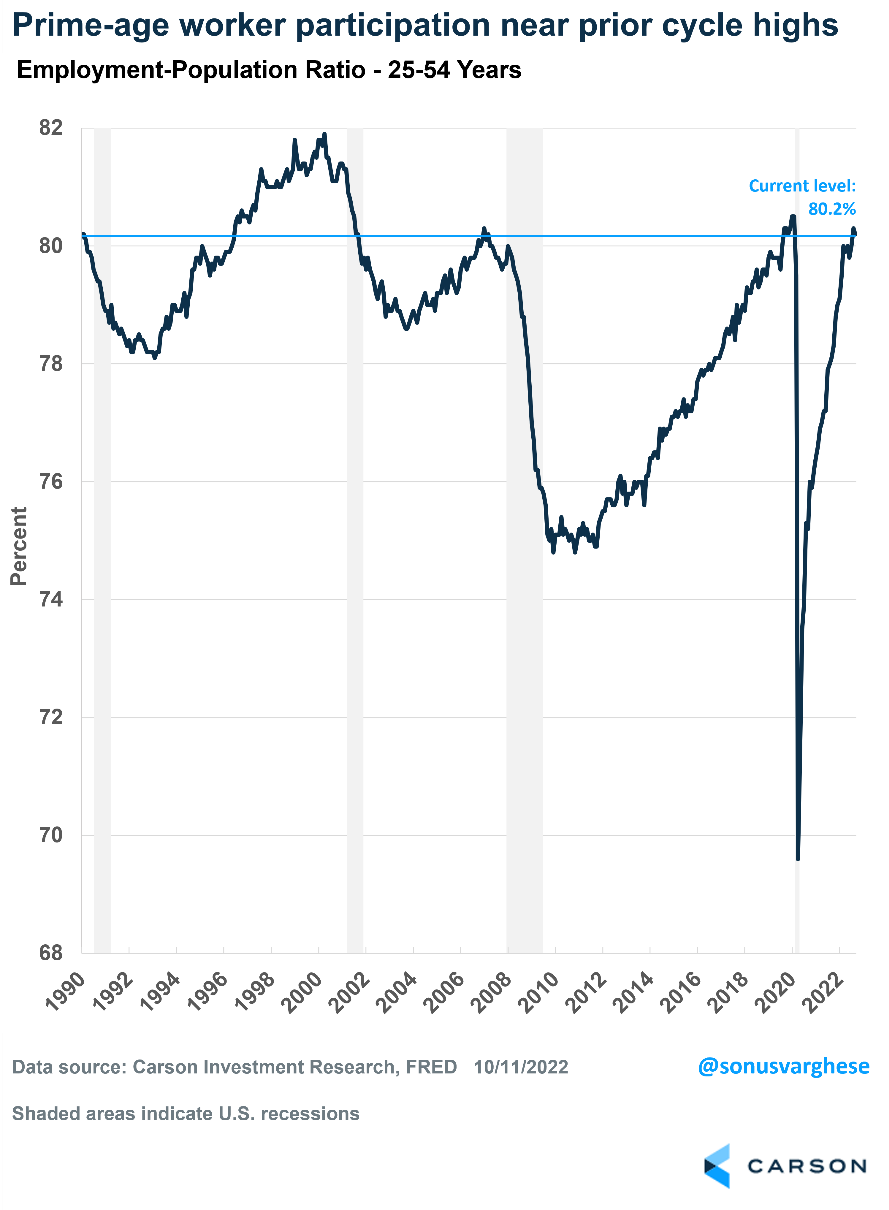
Prime-age employment-population ratio close to pre-pandemic levels
While the unemployment rate is the most widely cited measure of labor market strength, another useful measure is the employment-population ratio. It is the proportion of the working-age population that is employed. The prime-age employment-population ratio, i.e., workers between the ages of 25 and 54, avoids some of the issues that may impact the size of the labor force (which is used to calculate the unemployment rate), such as an aging population and people leaving the labor force for other reasons.
The good news is that the prime-age employment-population ratio is now at 80.2%, not far from the pre-pandemic high of 80.5%. The highest it got to during the 2003–2007 expansion was 80.3%. It did go higher in the late 1990s, indicating we may still have room for improvement.
-
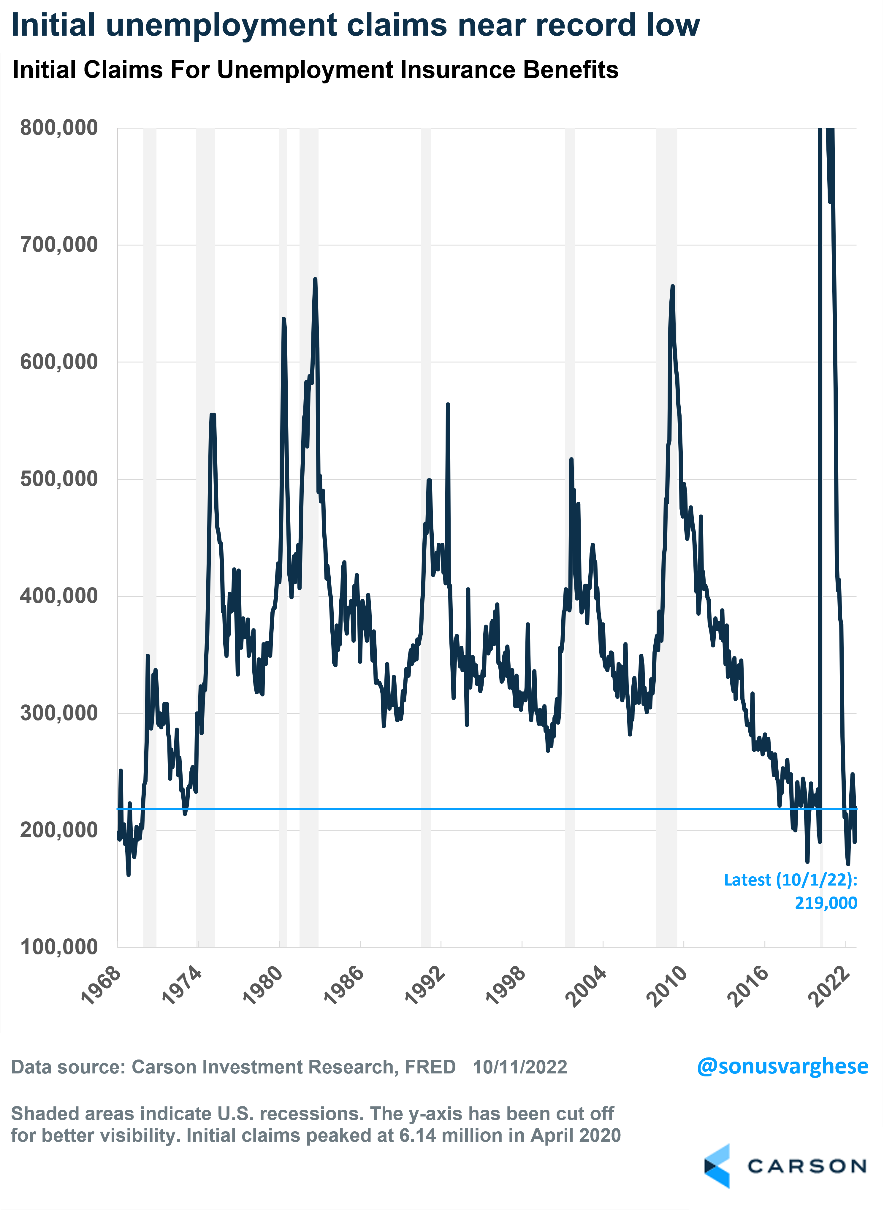
Initial unemployment benefit claims are near record lows
This is a popular leading indicator of the labor market that’s released weekly. Historically, a rise in initial claims for unemployment insurance benefits foreshadows a rise in the unemployment rate. Initial claims are currently drifting close to record lows (the latest was 219,000 as of Oct 1st). Even better news is the fact that “continuing claims” are around 1.36 million – the lowest level since the late 1960s and well below the pre-pandemic level of 1.8 million. Indicating that laid-off workers who file initial claims are quickly able to find a job, without continuing to receive unemployment insurance.
-
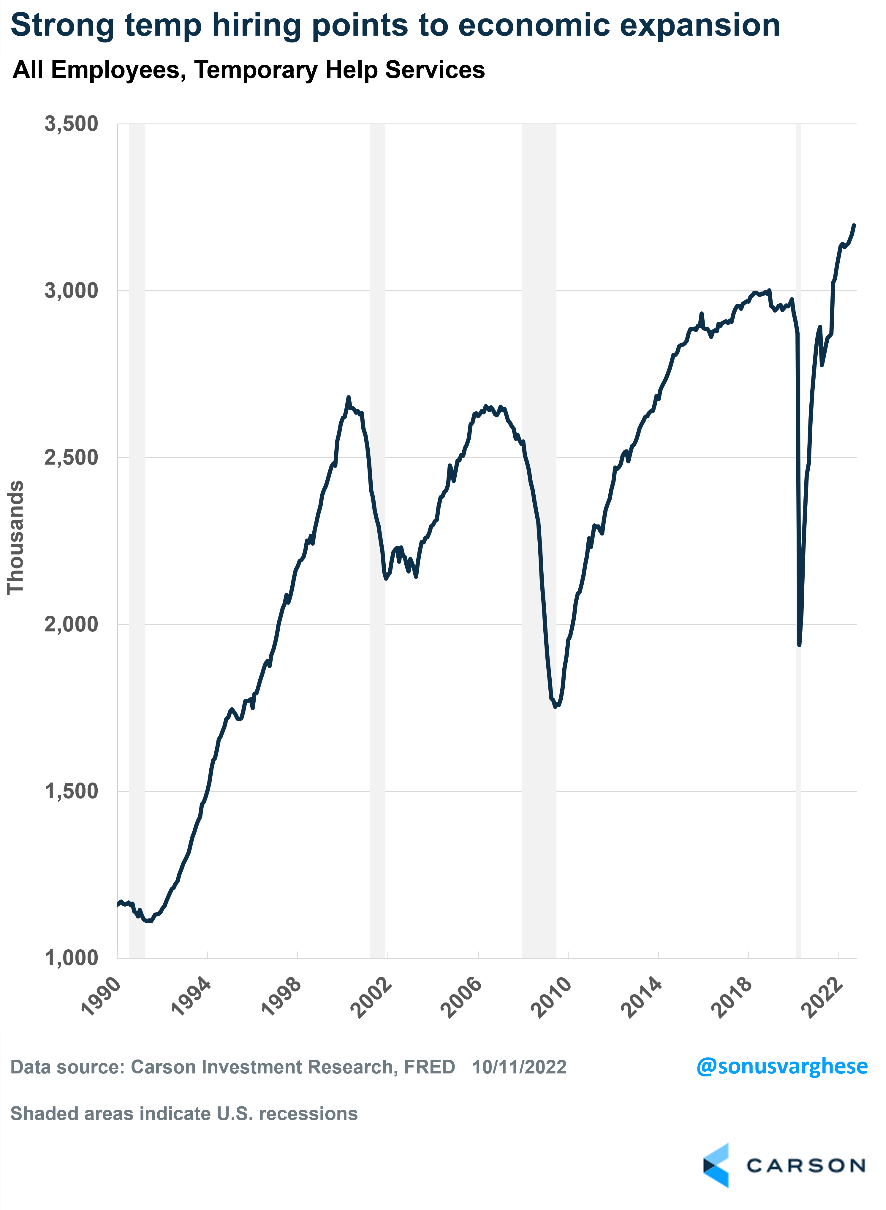
Temporary help services employment continues to rise
This may be one you haven’t seen before, but it’s one I like to keep an eye on as a leading indicator for employment. Over the last few decades, employers have increasingly relied on temps to fulfill staffing needs, giving them more flexibility.
When times are good and the economy is expanding, firms hire temps to ramp up quickly. And when times are bad, firms can scale down by letting temps go first, without laying off more experienced workers. We’ve seen temp employment fall prior to the start of the last four recessions. The current situation is very different, as temp help services employment has continued to rise, which is historically not something you would see if we were close to a recession.
There you have it – five charts that highlight the strength of the labor market. Reach out to your advisor if you’d like to discuss what current economic conditions might mean for your unique situation.
Content in this material is for general information only and not intended to provide specific advice or recommendations for any individual. All performance referenced is historical and is no guarantee of future results. The views stated herein are not necessarily the opinion of any other named entity. Opinions are subject to change without notice. Information is based on sources believed to be reliable; however, their accuracy or completeness cannot be guaranteed.
