

Stocks were flat last week, but the S&P 500 continues to hold above its June peak. This level is a logical area of support. The 50-day moving average, which is just below this area, provides additional support. For now, we’d expect these two areas of support to hold.
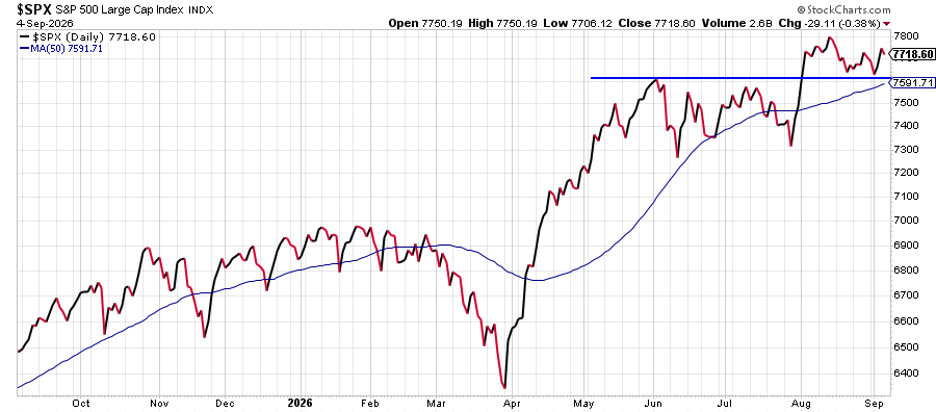
We noted last week that, historically, the month of September can be dicey for stocks, but we continue to expect this year to buck that trend, similar to the past two years in this most bearish month of the year. The longer stocks consolidate at current levels, the more we’d expect that eventual resolution to be higher.
The Pace of the Hikes Matter
The upcoming Fed decision on interest rates September 16 is going to be what most traders focus on this week, but how much would a 0.25% hike really matter? We do have a $31 trillion economy, after all. Also, last week saw strong manufacturing and services data, along with a much better picture of the labor market. The economy continues to improve, and a better labor market is something we’d view as a major positive.
Let’s be clear: Our base case remains the Fed is probably on hold the rest of this year and a hike in September isn’t likely, although it’s certainly possible. We don’t think they should be on hold, because inflation is high and the economy is more than capable of absorbing a hike, but that’s the direction Fed Chair Kevin Warsh is still leading them in. After last week, the odds of a rate hike are hovering around 60%. This week, we have very important inflation data due out on the consumer and producer level, which could push those odds much higher or lower.
Even if we do hike, it’s the pace of the hikes that really matters. After the first hike in four of the last five cycles, the S&P 500 was actually higher a year later. It did decline in the first month after the hike, so some early rockiness is possible, but that just makes being higher a year after the first hike that much more impressive. The exception, of course, was the 2022-23 hiking cycle, which took the upper bound of the fed funds rate from 0.25% to 5.5% and included two 0.5% hikes and four 0.75% hikes! Not at all what we’re expecting this time around.
Let’s cross this bridge when we get there, but the reality is all we hear about on TV is whether the Fed will hike 0.25% or not. To us, the potential improvement in the labor market is a more welcome development, and one that suggests the economy should continue to improve. Should there be a hike, the economy will take it in stride.
Payrolls Confirm the Economy Is Clearly Running Hot
The evidence for a hot economy keeps racking up. The industrial economy is clearly in a boom on the back of enormous AI-related investment. A lot of folks pointed to a slowdown in payroll growth in recent months to counter that, never mind that the unemployment rate is near historical lows at 4.1%. Well, the August payroll report should settle the debate for now, though we hardly imagine it will, including within the confines of the Fed.
The economy created 162,000 jobs in August, the highest monthly gain since March. One-month payroll numbers can be noisy and tend to be revised, and that’s why it’s better to use a three-month average. Last month, the three-month average of job growth was at a rather worrisome 20,000, but with upward revisions to June and July data, that’s risen to 71,000.
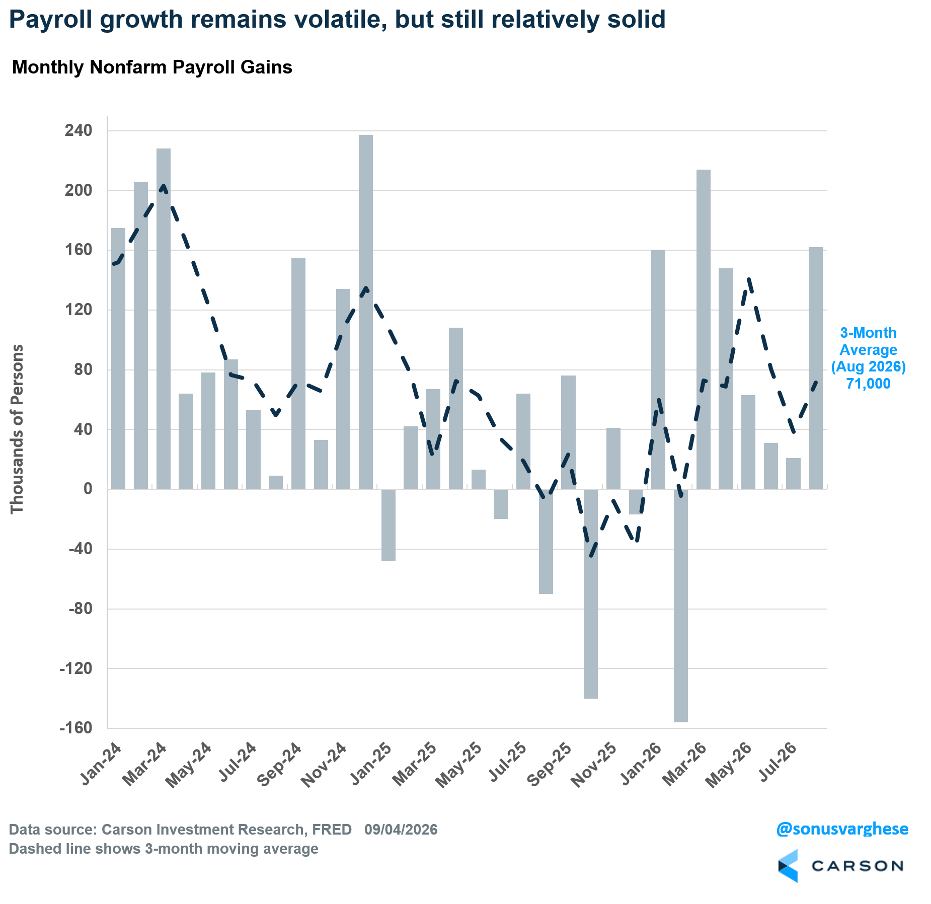
A three-month average of 71,000 for job growth doesn’t seem spectacular, but keep in mind that with labor supply running low, especially with the immigration stall, the economy needs to create fewer jobs to keep up with population growth. There are fewer people to hire, and so hiring looks weaker even though the labor market is in good shape. This is underlined by the fact that the unemployment rate remained steady at 4.1% in August, near historical lows and much improved from last year, when it hit 4.4%. The unemployment rate has now been at 4.5% or below for a record 59 consecutive months, or almost five years.
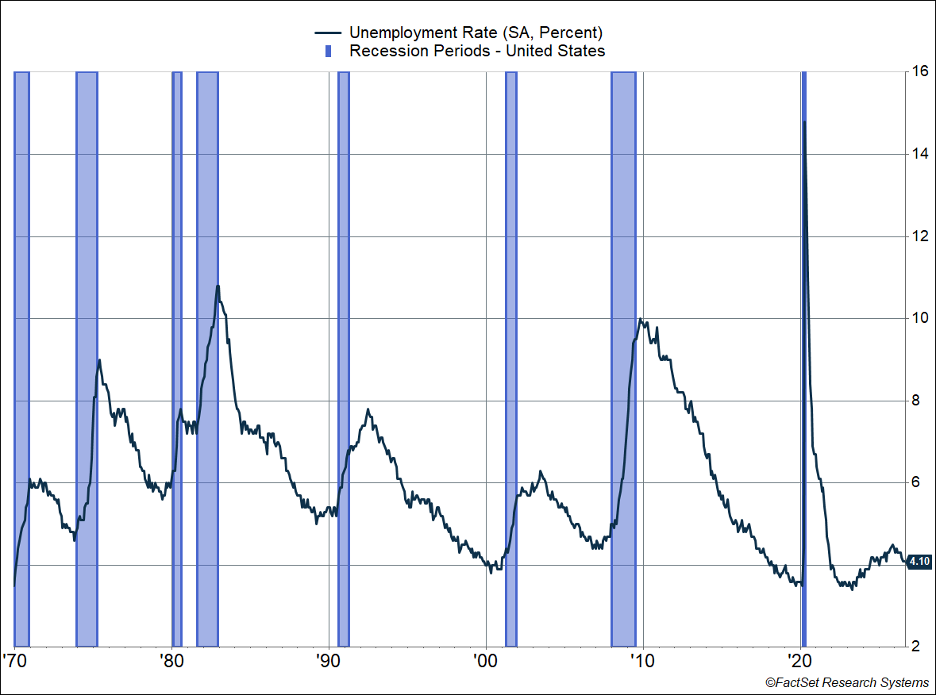
Data as of 9/4/2026
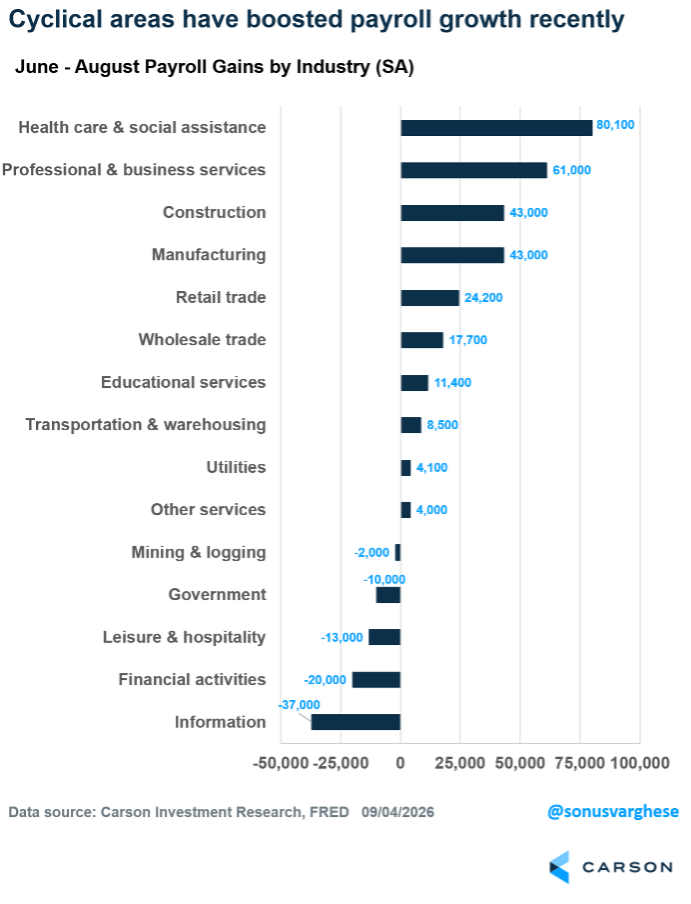
Labor market improvement is also evident if you look at the cross-section of payroll growth across industries over the last three months. The private sector has created 224,000 jobs over this period, and the leading contribution has come from the healthcare sector, which accounted for 37% of that (80,000). However, the next several leading areas are all cyclical parts of the economy, like professional and business services (+61,000), construction (+43,000), manufacturing (+43,000), and retail and wholesale trade (+42,000). These together account for 88% of job growth since June. Construction is being boosted by data center construction, while manufacturing improvement is coming from the durable goods sector, also largely an AI-related story.
One area that is struggling is “information,” which is mostly because of layoffs in the telecom and tech sector. But rather than this being driven by AI, it’s more likely a story of tech companies needing to cut labor costs as they spend more on AI infrastructure.
We’re in a Period of Strong Inflationary Growth
When we say the economy is running hot, we mean the nominal economy. Think of it like nominal GDP growth, which is the sum of real GDP growth and inflation. Real GDP growth is likely running close to trend, but inflation is clearly elevated. In other words, we’re looking at nominal GDP growth continuing to run close to 6%, which is well above the 2010-19 trend of 4% and closer to the late 1990s pace.
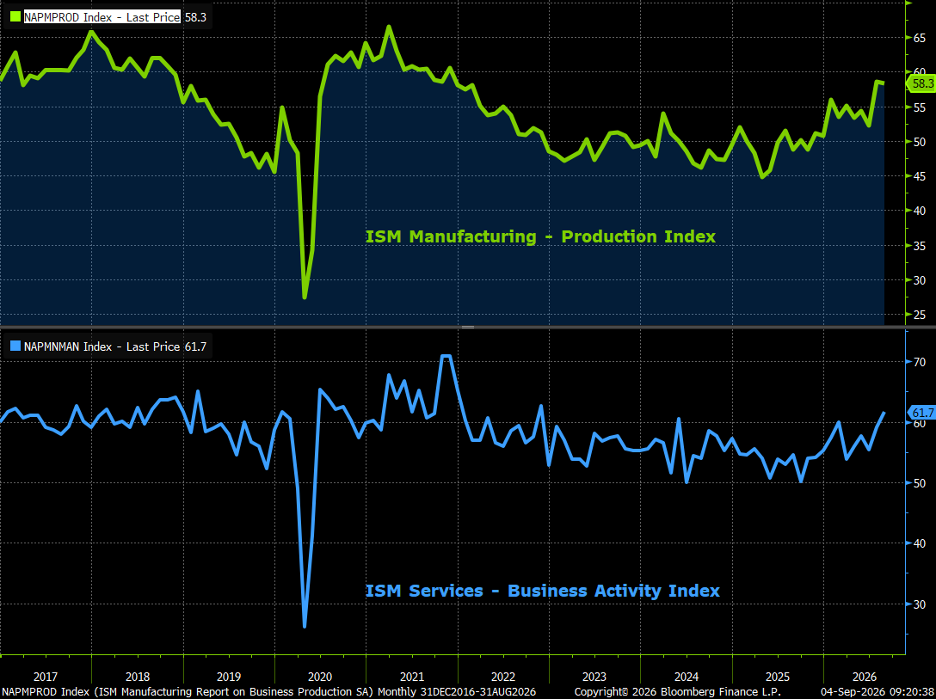
The economic environment we’re in was neatly captured in a couple of ISM PMI reports for August. These are indices created from surveys of purchasing managers across manufacturing and services industries. The headline numbers were strong, with the Manufacturing PMI at 54.6 and the Services PMI at 55.4. A reading above 50 says the sector is expanding, and right now, we’re well above that.
The production sub-index within the manufacturing PMI came in at 58.3, while the business activity sub-index within the services PMI clocked in at 61.7. This tells you that activity is running strong across the economy. The level and upward momentum are the strongest we’ve seen in more than five years, and even better than in 2019, especially on the manufacturing side.
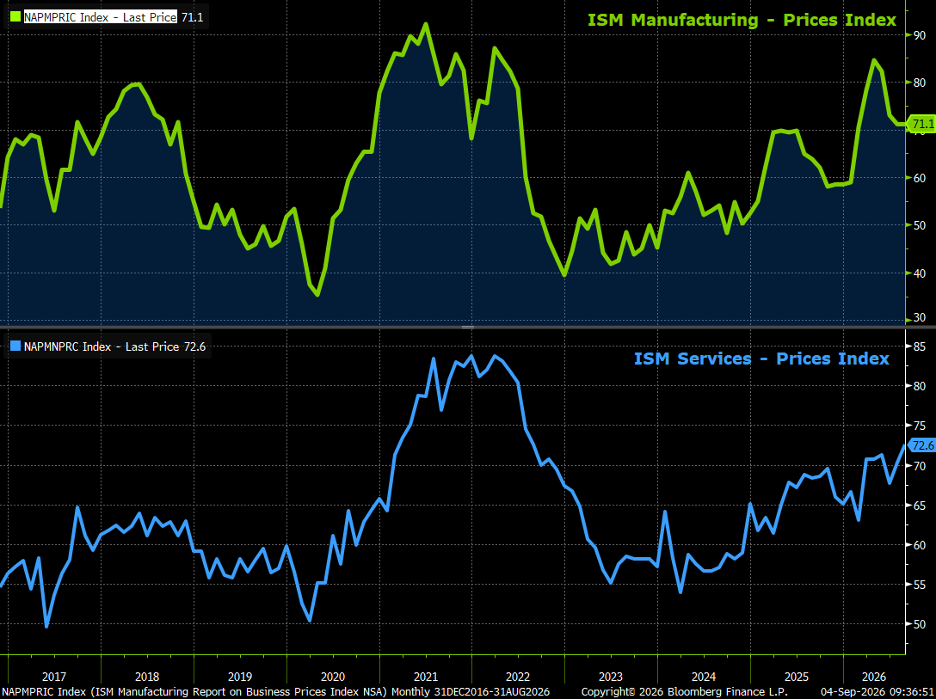
The bad news is that inflation remains hot, with purchasing managers seeing no letup in prices of raw materials and other inputs. A reading above 50 points to rising prices, and we’re way above that.
- The manufacturing prices index has eased since April thanks to easing gasoline prices, but it’s still at a very elevated level of 71.1.
- The services prices index continues to ratchet higher, hitting 72.6 in August, the highest level since August 2022 and well above anything we saw in 2017-19.
Bottlenecks Are Keeping Input Prices Elevated
Prices are rising because several key inputs are in short supply, including copper, electrical and electronic components, memory components, printed circuit boards, wires and cables, and steel. Copper prices have surged more than 40% over the past year (+13% year to date) and are at the highest level we’ve seen in years.
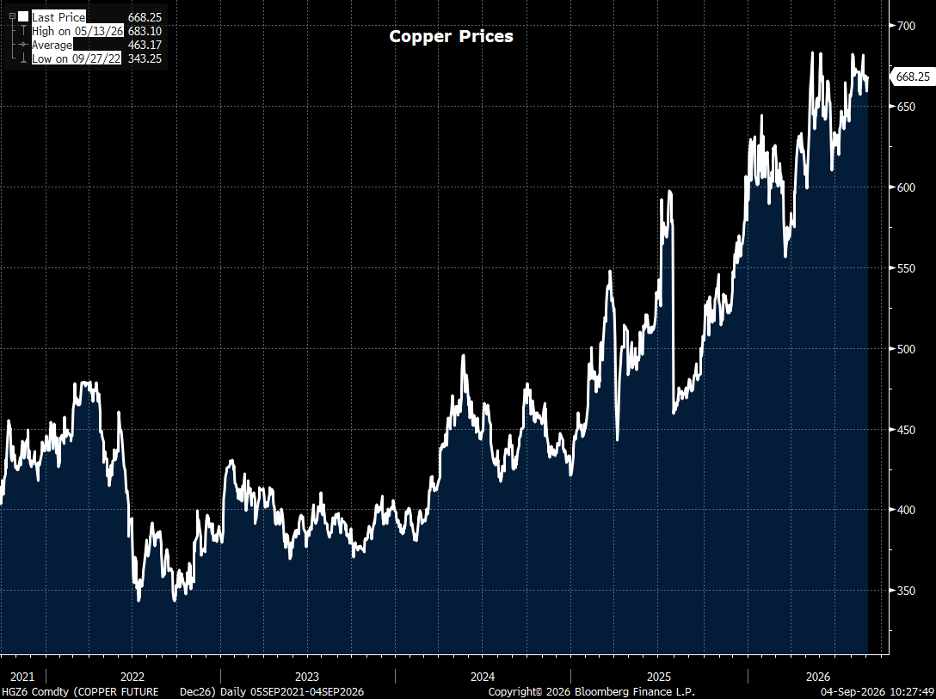
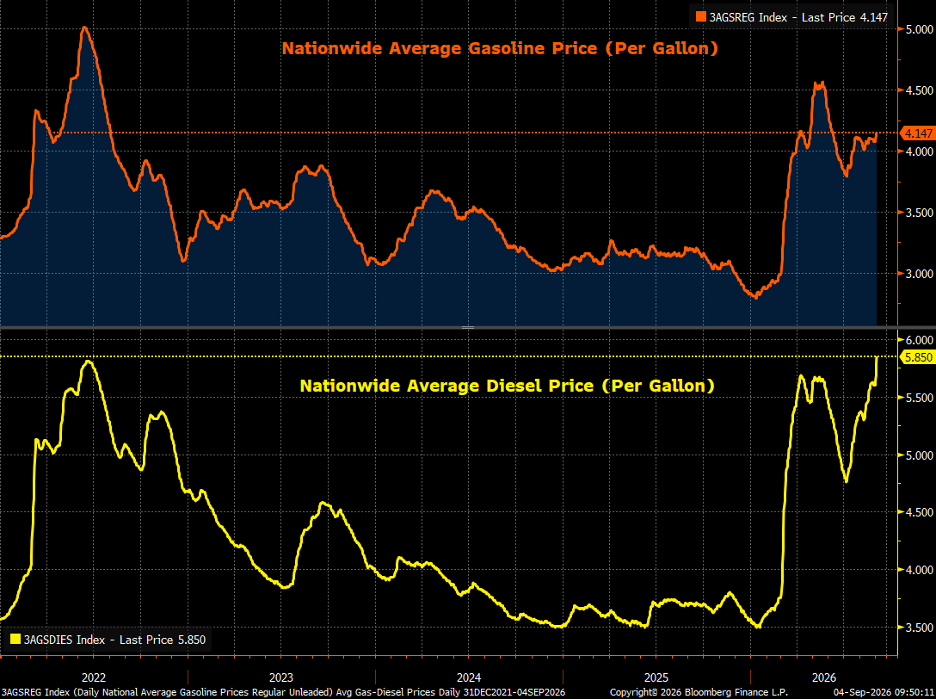
The story is about bottlenecks arising from the AI-infrastructure boom and the trade war. This is on top of the fact that the Middle East crisis shows no sign of abating, and that’s keeping oil prices elevated. The Strait of Hormuz bottleneck is a bigger problem for refined products, and on top of that, Ukraine’s targeting of Russian refineries only adds to price pressure. Diesel prices just hit a record high of $5.85/gallon, even higher than in 2022. Keep in mind that diesel is the fuel that transports all sorts of goods across the country and the globe, including food. Gasoline prices are also at the highest level ever for this time of the year, with the nationwide average at $4.15/gallon.
This Is Not Stagflation, but the Fed Is Offsides
Keep in mind that the companies selling all these inputs benefit, as their margins rise when prices go up, whether it’s chip companies, energy companies, or mining firms. This is why an inflationary growth period can be good for stocks. It’s important not to confuse this with “stagflation,” which is a period of high inflation and rising unemployment. The latter is clearly not the case right now.
Of course, the big question is what the Fed does now in the face of all this data. In our opinion, policymakers are clearly offsides relative to where the economy is. Yet markets perceive the Fed as being extremely reluctant to hike interest rates, with the bar for hiking a lot higher than the bar for reducing rates. It beggars belief that the probability of a rate hike at the Fed’s September meeting is still just over 60%, or much closer to a coin toss rather than 100%. As we have written before, keeping rates unchanged given the economic environment means policy is getting easier, and right now even a 0.25% to 0.5% increase in policy rates may not be enough to cool things down.
For now, it looks like policymakers are willing to let things run hot. But that also means that once they start raising rates, they’ll have to tighten policy even more, and leave it tight for longer, just to catch up. That’s a recipe for more volatility.
S&P 500 — A capitalization-weighted index of 500 stocks designed to measure performance of the broad domestic economy through changes in the aggregate market value of 500 stocks representing all major industries.
The NASDAQ 100 Index is a stock index of the 100 largest companies by market capitalization traded on NASDAQ Stock Market. The NASDAQ 100 Index includes publicly traded companies from most sectors in the global economy, the major exception being financial services.
The views stated in this letter are not necessarily the opinion of Cetera Wealth Services LLC and should not be construed directly or indirectly as an offer to buy or sell any securities mentioned herein. Investors cannot invest directly in indexes. The performance of any index is not indicative of the performance of any investment and does not take into account the effects of inflation and the fees and expenses associated with investing.
A diversified portfolio does not assure a profit or protect against loss in a declining market.
All investing involves risk, including the possible loss of principal. There is no assurance that any investment strategy will be successful. This information is from sources believed to be reliable, but Cetera Wealth Services, LLC cannot guarantee or represent that it is accurate or complete.
9114464.1-0926-C
